Build Smarter Apps and Unlock Insights

Einstein Analytics Overview

Einstein Analytics Overview

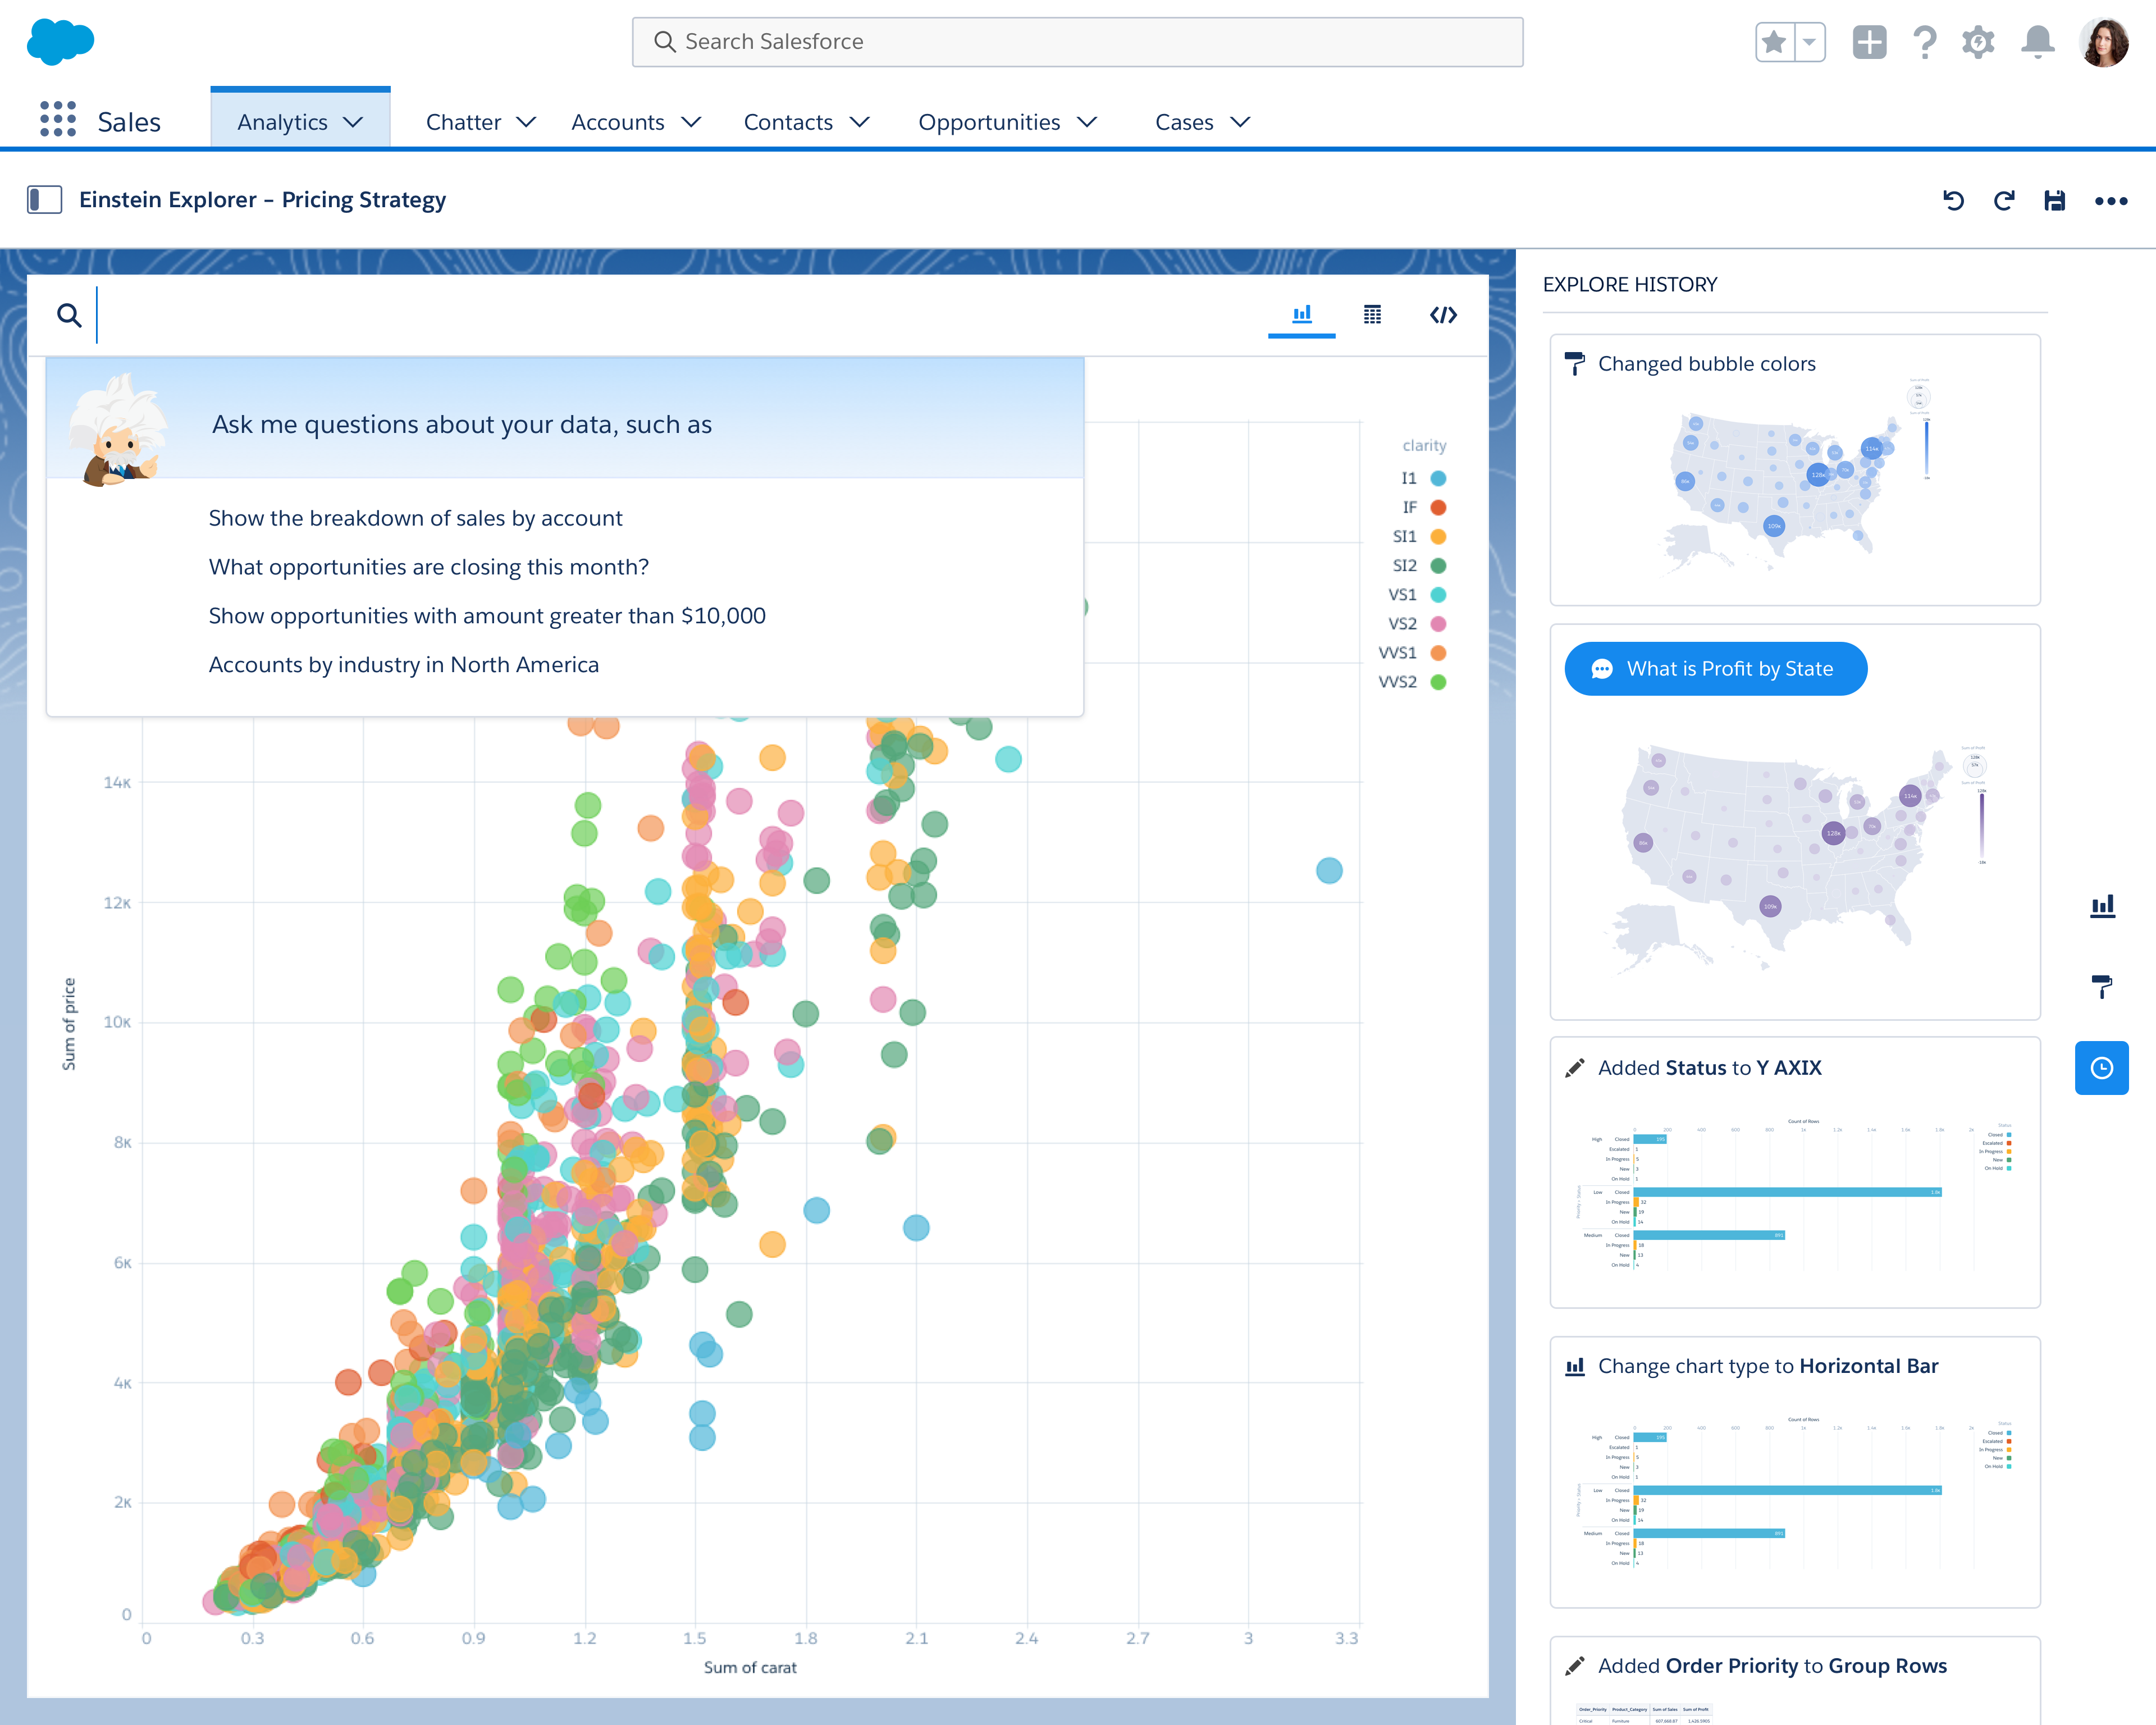
Einstein Analytics allows you to explore all of your data quickly and easily by providing AI-powered advanced analytics, right in Salesforce. Manage your datasets, query data with Salesforce Analytics Query Language (SAQL), and customize dashboards, all programatically.

In addition to offering pre-built apps for Sales, Service, and Marketing, the Einstein Analytics Platform gives you the flexibility to:


  • Build your own custom, intelligent analytics apps
  • Utilize our APIs and SDKs to enhance your app
  • Connect to outside data sources to see all of your data in one place

Build Customized and Intelligent Apps

Build Customized and Intelligent Apps

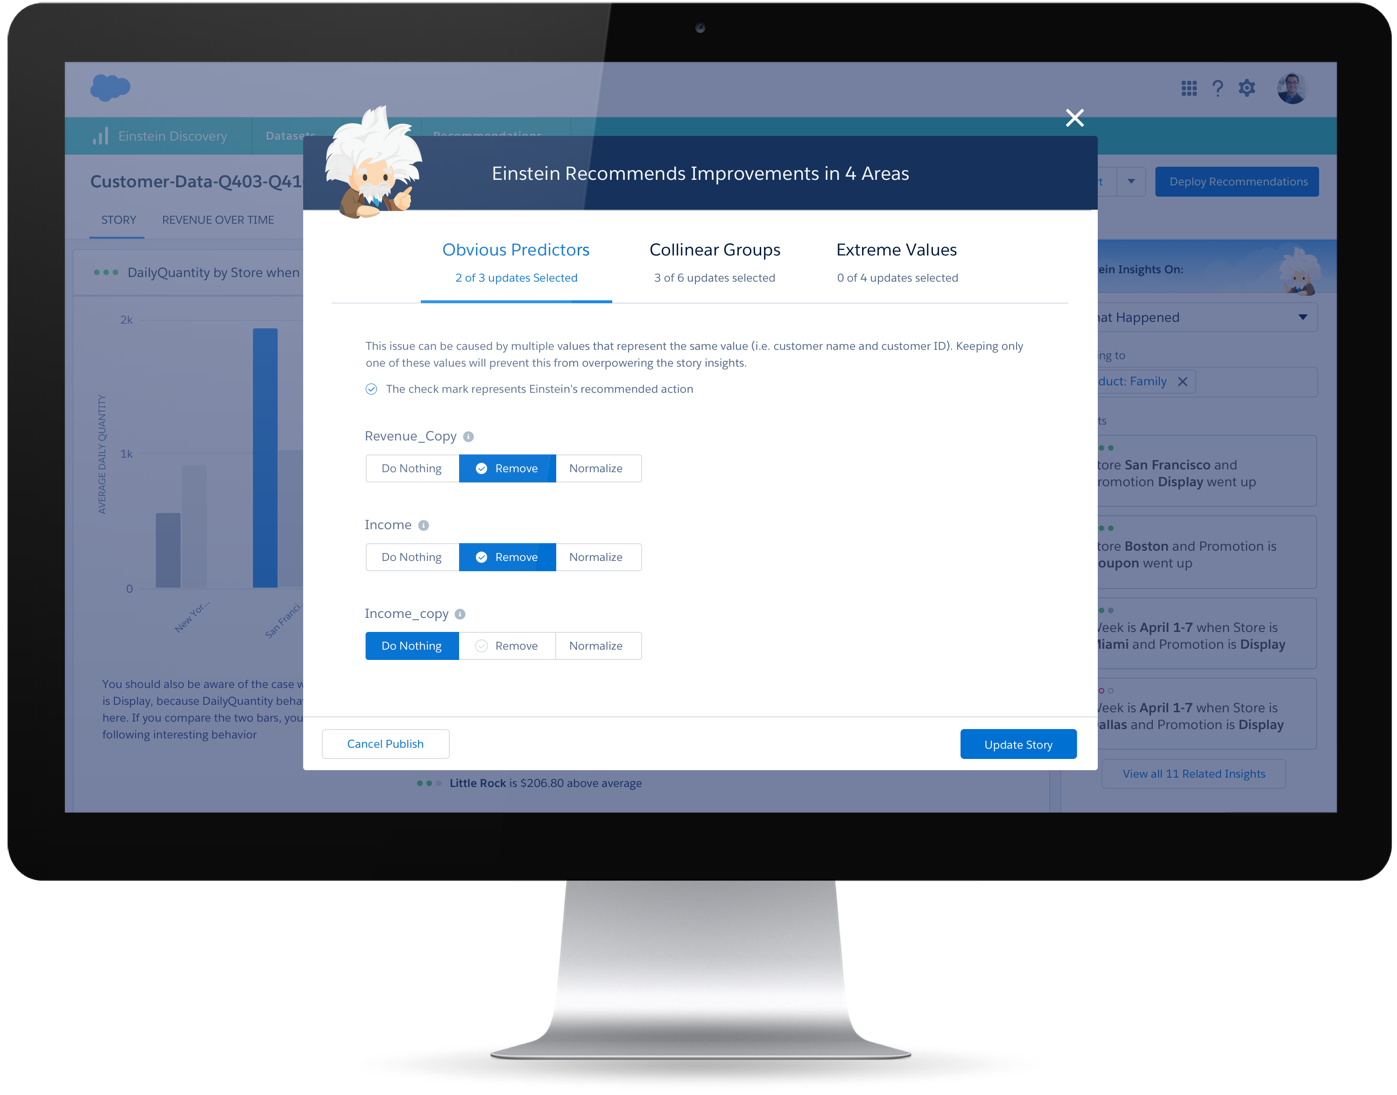
Einstein Analytics brings actionable insights to the business user. Key features:


  • Templates. Build upgradeable and customizable AppExchange apps. Utilize templates to get the perfect design for the dashboard.
  • Wizards. Easy to build widgets that summarize your data. Widget interactivity to answer different types of questions without leaving the dashboard.
  • Layout Builder. Layouts to optimize the dashboard for different devices.

Salesforce Platform

Salesforce Platform

  • Customize and extend your CRM solution with myLightning. Tailor your CRM with point-and-click ease and empower everyone-developers, admins and business users.
  • Engage employees with apps. Rapidly build AI-powered employee apps that automate business processes and give every employee a view of the customer.
  • Create amazing customer experiences. Create apps in any language your developers want with built-in AI. Even connect to IoT.
  • Analytics Web SDK. Interact with Lightning, Visualforce and more.
  • Apex. Use Apex to pull data in real time to your Einstein Analytics dashboard.


Create Analytics Datasets

Create Analytics Datasets

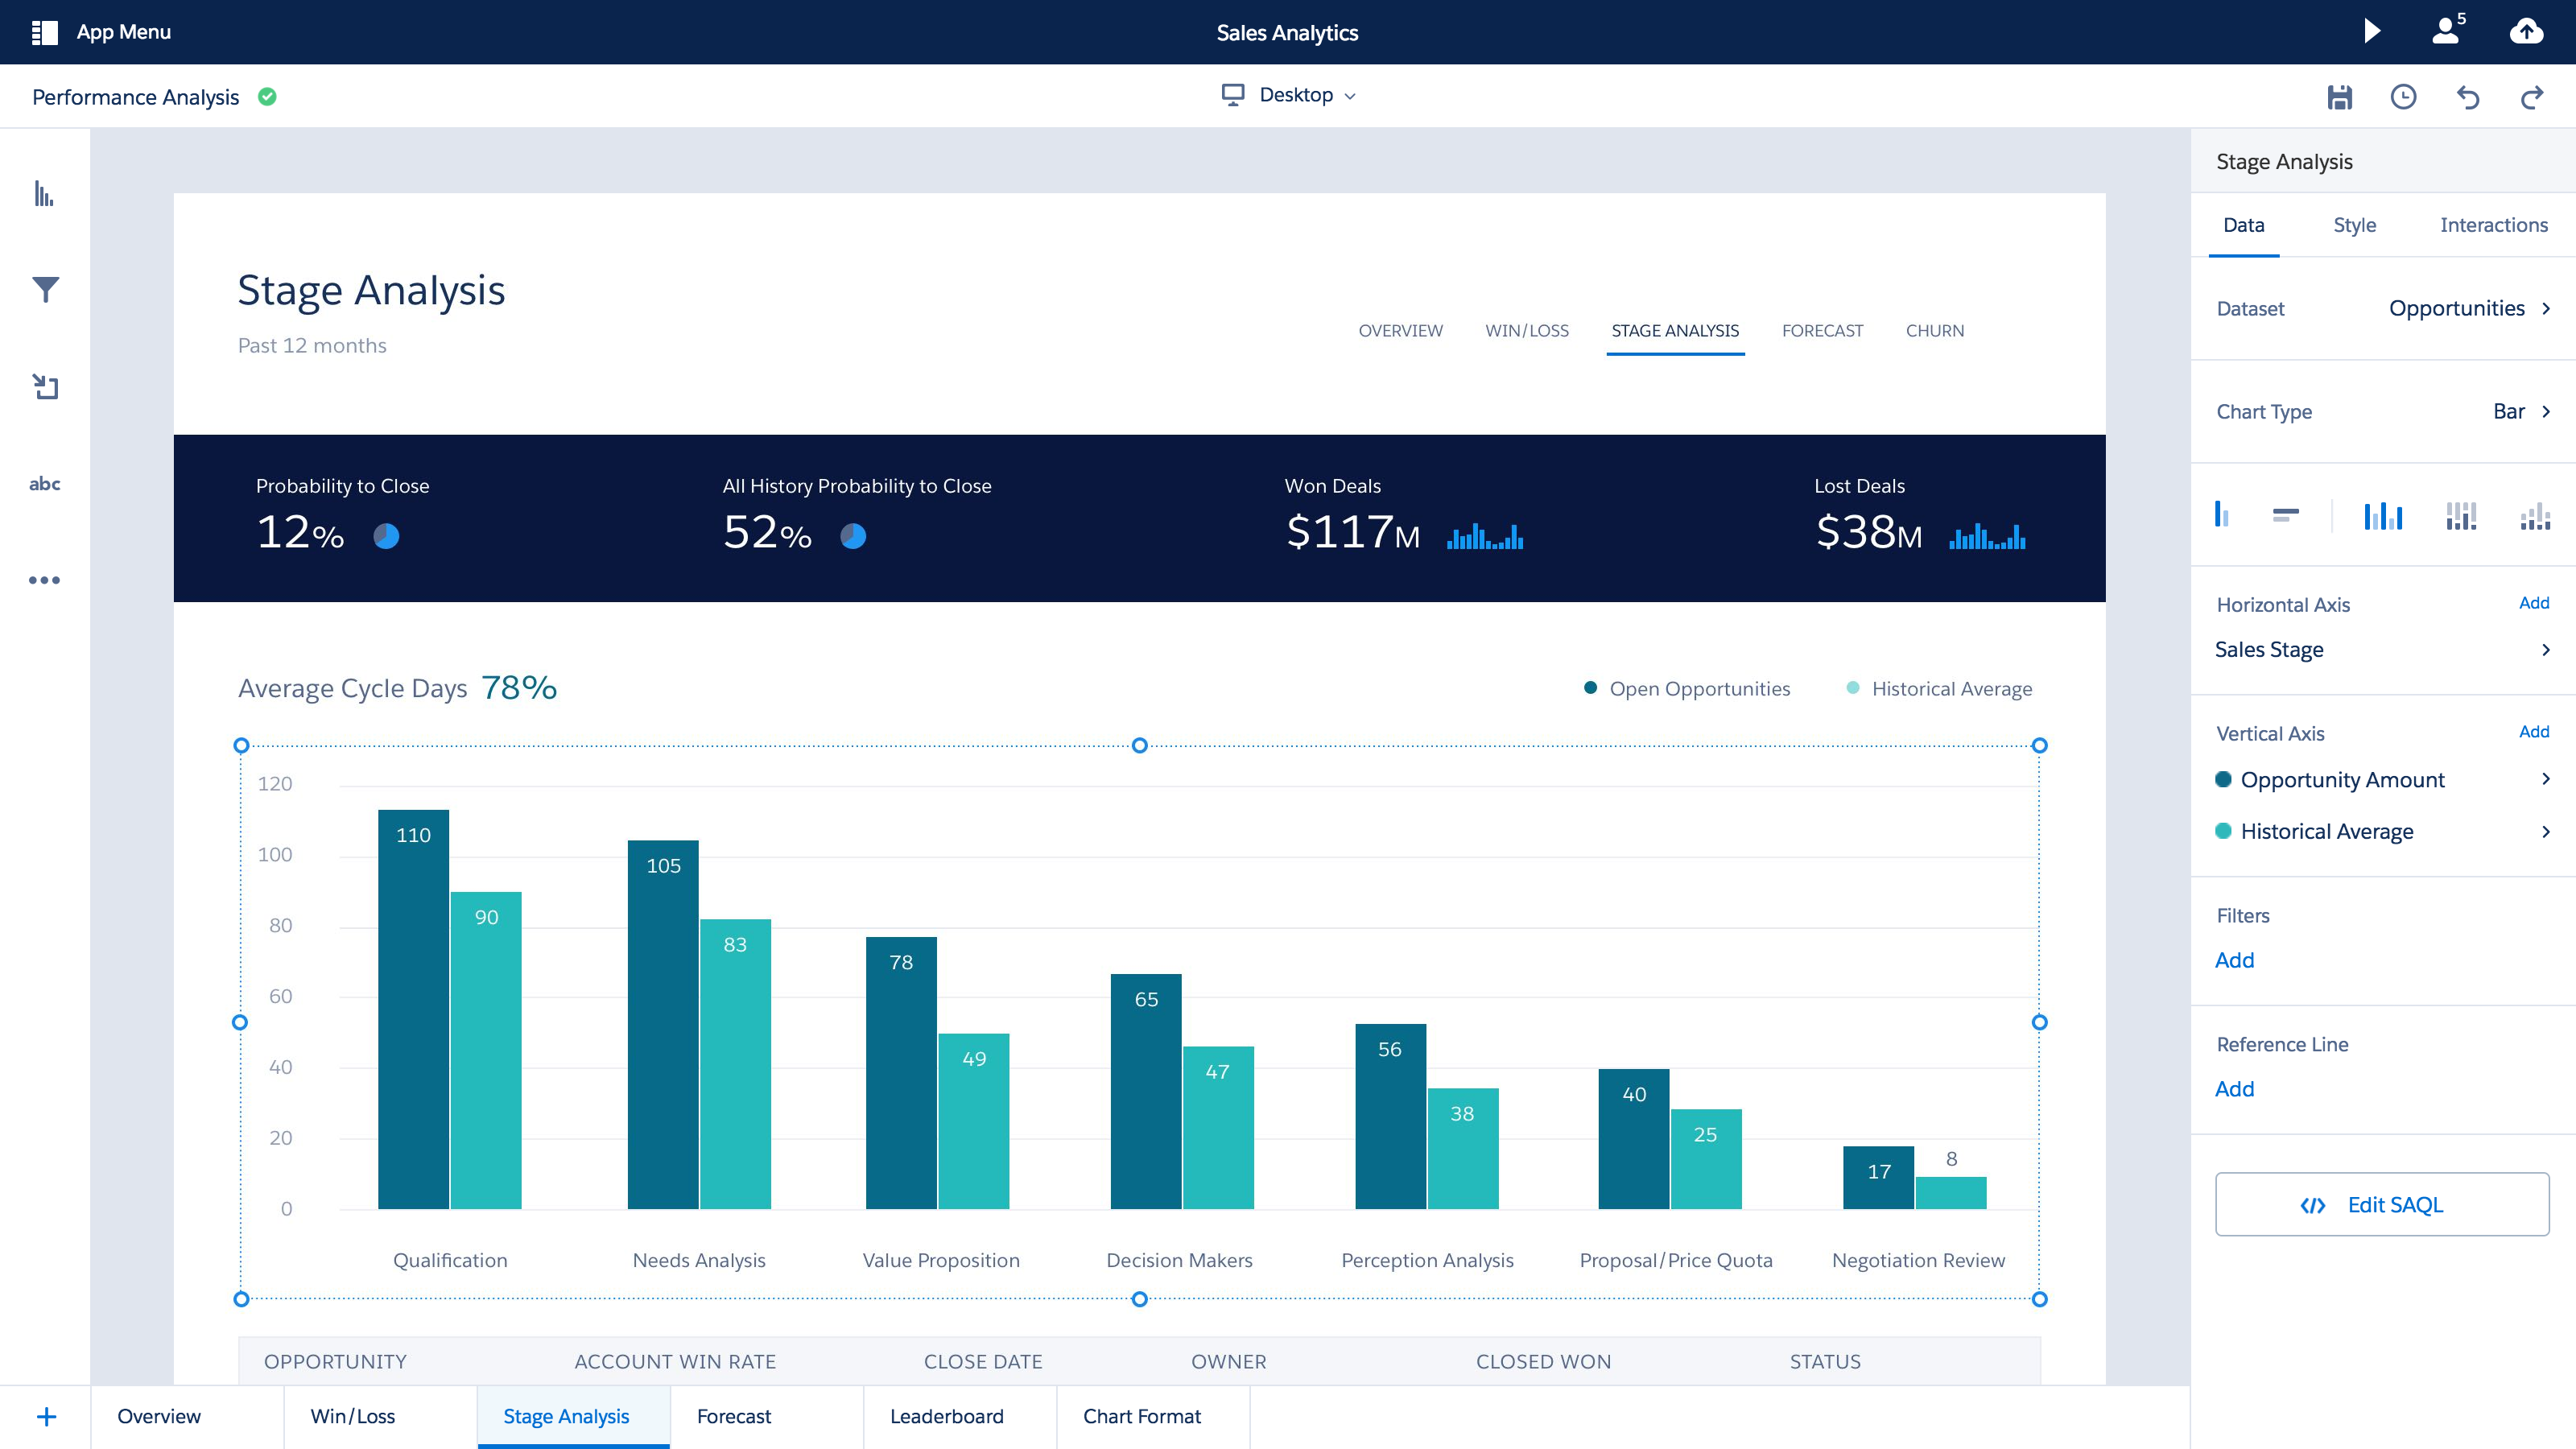
Create Analytics datasets and produce useful charts from those datasets. With Analytics charts, you can transform tables of data into beautiful and informative visualizations that won't require your audience to do math in their heads. Chart types include Pyramid Chart, Waterfall Chart and Map Chart.


Analytics has built-in map charts of various geographical areas. You can use them like any other chart to display a visualization of your data.


Get Started

Get Started

Sign Up for an Analytics Developer Edition Org: Unlike the regular Developer Edition org, the Analytics-enabled one comes with a limited Analytics platform license and contains sample data required for this module. Sign up here.